
How to measure lifecycle emissions in low-carbon mobility systems

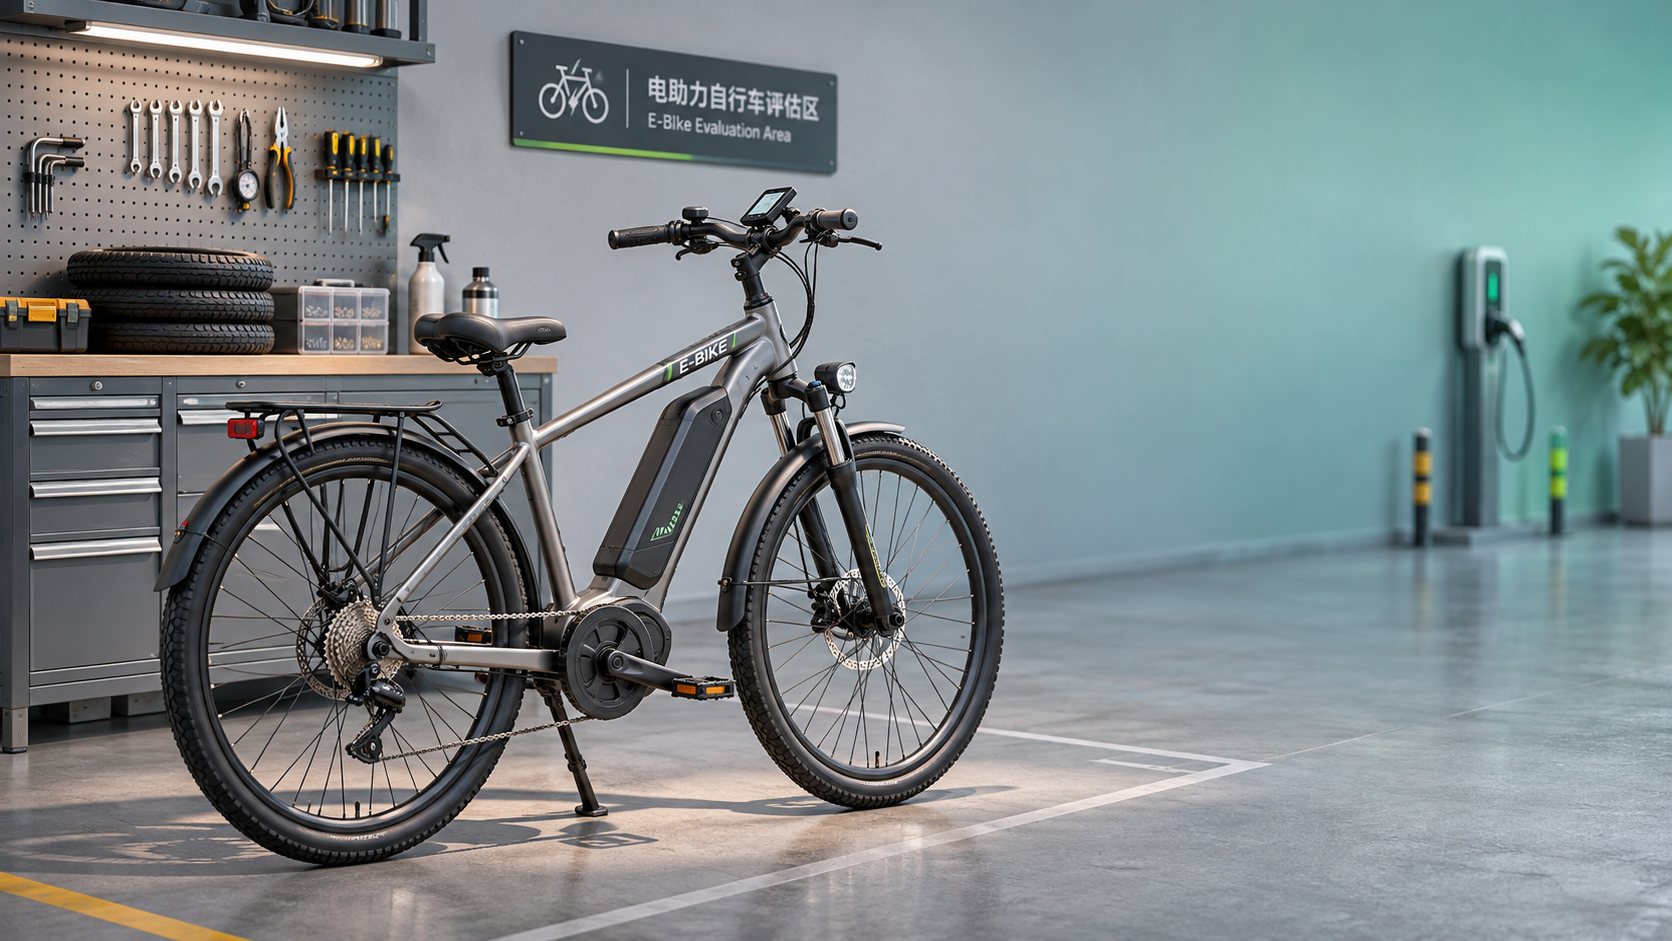
How can technical evaluators determine whether low-carbon mobility systems deliver genuine emissions reductions? The answer lies in measuring greenhouse gas emissions across the full vehicle lifecycle, from raw material extraction and manufacturing to operation, maintenance, and end-of-life treatment. For e-bikes, e-scooters, and electric motorcycles, results depend on factors such as battery production, electricity mix, vehicle lifespan, and distance traveled. A practical lifecycle assessment starts by defining system boundaries, selecting meaningful functional units, and comparing mobility options on a consistent basis.
The distinction between a vehicle footprint and a mobility outcome matters. A low-emission vehicle can still produce disappointing system-level results if it is replaced frequently, transported long distances for charging, or used mainly for trips that would otherwise have been walked. Conversely, a vehicle with a relatively high manufacturing footprint may perform well over a long, intensively used service life. Neither conclusion follows from the powertrain alone.
Define the service before collecting emissions data
A lifecycle assessment, or LCA, needs a clearly stated goal: is the study comparing frame materials, evaluating a shared scooter fleet, or estimating the effect of replacing motorcycle trips? Each question calls for different data and may require a different boundary. A component-level assessment can support a design decision, but it cannot by itself establish that a transport service reduces emissions.
For vehicle comparisons, a useful functional unit is often grams of carbon dioxide equivalent per passenger-kilometer, expressed as g CO2e/passenger-km. It connects emissions to the transport service delivered. Define the operating context alongside it: trip characteristics, geography, expected service life, occupancy, and whether the vehicle is privately owned or shared. For a component study, a unit such as one frame delivering a specified structural function over a defined service life may be more appropriate.
Passenger-kilometers should reflect actual transport, not simply the vehicle’s odometer reading multiplied by an assumed maximum capacity. If alternatives provide different levels of access, speed, cargo capacity, or weather protection, disclose those differences. A scooter and an electric motorcycle can both cover short trips, but they do not necessarily provide equivalent service in every setting.
Set a boundary that follows the vehicle and the service
A cradle-to-grave assessment normally includes material extraction and processing, component production, assembly, distribution, use, maintenance, and end-of-life treatment. For electric vehicles, battery production and replacement deserve explicit treatment rather than a single unexplained allowance.
For a shared mobility service, expand the inventory to the activities needed to keep vehicles available. These can include collection, rebalancing, charging operations, warehouse energy, repairs, and transport of spare parts. Charging infrastructure, connected hardware, and digital services may also be relevant; assess their likely significance and document any exclusions. A private e-bike charged at home has a different operational boundary from a scooter fleet serviced by vans.
Boundary decisions should be visible, especially when reviewing a supplier’s footprint. Ask whether the figure covers a complete vehicle or only manufacturing, whether it includes packaging and distribution, and whether battery replacements are included. Two results expressed in the same unit can still be incompatible if one omits fleet operations or assumes a substantially different lifetime.
Build the lifecycle inventory around measurable activity
The inventory translates physical activities into emissions using appropriate factors. In simplified form, each contribution is calculated as activity data multiplied by an emissions factor. The results are then summed across the defined lifecycle and divided by the transport service delivered. This requires consistent units, a stated impact assessment method, and a declared time horizon for global warming potential, commonly 100 years.
Primary data should be sought where it can materially change the decision: component masses, manufacturing energy, battery specifications, electricity purchased for charging, maintenance records, and verified fleet mileage. Where supplier data are unavailable, use documented secondary datasets that match the material, geography, technology, and reference period as closely as possible. Record the database version and explain substitutions rather than treating generic data as measured factory performance.
Manufacturing and lightweight materials
A bill of materials provides the starting point, not the entire manufacturing footprint. Production losses, energy-intensive processing, assembly, and transport between facilities can matter. For a carbon fiber frame, request information on fiber and resin inputs, layup scrap, curing energy, and the treatment of rejected parts. A lighter frame may reduce energy demand in use, but that benefit must be tested against its production footprint, actual duty cycle, and service life.
The same discipline applies to precision drivetrains and electronic derailleurs. Include relevant materials, electronics, batteries, and expected replacement parts when they fall within the study boundary. Do not assume that faster shifting or lower component weight automatically produces a measurable lifecycle reduction; the assessment needs evidence of the effect on energy use, durability, or maintenance.
Electricity, charging, and battery replacement
Use electricity measured at the wall where possible, because energy drawn from the grid includes charging losses that a battery-output figure may miss. Pair consumption with an emissions factor appropriate to the charging location and assessment purpose. State whether the factor represents an average grid mix or another electricity accounting approach, and keep comparisons consistent. If time-specific charging data are unavailable, disclose that limitation rather than presenting an hourly result as measured.
For batteries, document chemistry, capacity, mass, manufacturing geography where known, and the source of production factors. Model replacement using a stated rule tied to service conditions or observed records. A battery that is replaced before the vehicle is retired adds production and end-of-life impacts; a battery reused elsewhere also raises allocation questions that need to be handled transparently. Avoid counting the same battery burden or recycling benefit twice.
Maintenance and end of life
Tires, brake parts, chains, cassettes, bearings, and electronic components may be replaced at different intervals. For heavily used fleets, maintenance transport and labor-related facility energy can also be relevant if included in the system boundary. Use actual maintenance records when available; otherwise, show the assumed replacement intervals and test their effect on the result.
End-of-life modeling should distinguish collection, dismantling, material recovery, disposal, and any assigned recycling credits. A material being technically recyclable does not prove that it will be collected or recovered in the assessment geography. Disclose the allocation method and avoid comparing a result that includes generous recovery credits with one that excludes them without adjustment.
Calculate the result—and show what drives it
A practical vehicle-service calculation is:
Lifecycle emissions per passenger-kilometer = total emissions within the system boundary ÷ total passenger-kilometers delivered over the assessment period.
Total emissions include production, distribution, charging, maintenance, service operations, and end-of-life treatment as defined in the study. If calculating in kilograms of CO2e and reporting in grams, convert the numerator consistently. For a fleet, use the emissions and passenger-kilometers of the same fleet and period; account for vehicles entering or leaving service and avoid assigning a full lifetime manufacturing burden to a partial operating period without explaining the allocation.
Report a breakdown by lifecycle stage rather than only the final intensity. This reveals whether a proposed intervention addresses a meaningful source. If fleet servicing dominates, a modest frame-weight reduction may be less consequential than changing collection routes. If manufacturing dominates, extending useful life or improving repairability may deserve closer examination.
Test the assumptions that can reverse a comparison
Sensitivity analysis is especially valuable when two alternatives have similar results. Change one assumption at a time, then examine plausible combined scenarios. The purpose is not to find the most favorable number; it is to identify the conditions under which a decision remains credible.
- Lifetime distance: Test lower and higher realized mileage, including early retirement, theft, damage, and downtime where relevant.
- Battery life: Compare scenarios with no replacement and with a replacement when both are plausible for the duty cycle.
- Charging electricity: Use alternative documented factors or future scenarios without presenting forecasts as measured results.
- Fleet logistics: Vary service distance, vehicle load, and collection frequency using operational records or transparent assumptions.
- Materials and recovery: Test uncertain production factors, scrap rates, and end-of-life allocation choices.
A range is more useful when its basis is clear. Separate measurement uncertainty from scenario uncertainty: an imprecise electricity meter is a different problem from not knowing how long a vehicle will remain in service. If a ranking changes within reasonable assumptions, report that explicitly and identify the data needed to resolve it.
Do not confuse vehicle intensity with avoided emissions
A result in g CO2e/passenger-km describes the assessed service. A claim that the service reduces emissions requires a counterfactual: what would users have done otherwise? The answer may include car, public transport, conventional bicycle, walking, trips not previously made, or a mixture. Use trip surveys or other defensible local evidence, and explain their limitations.
Compare like-for-like trip distances and include relevant lifecycle impacts of the displaced modes. Public transport requires particular care: average passenger intensity does not necessarily represent the change caused by a small number of passengers switching modes, because service supply may or may not change. Present the assumed response rather than treating it as automatic. Induced travel and changes in access or route length can also affect the outcome.
Use standards to make the assessment reviewable
ISO 14040 and ISO 14044 provide the general principles and requirements for lifecycle assessment. ISO 14067 addresses the carbon footprint of products and builds on the LCA framework. The GHG Protocol Product Life Cycle Accounting and Reporting Standard offers another product-level accounting framework. Check the applicable editions, any relevant product category rules, and the intended use before selecting a method; naming a standard alone does not demonstrate conformity.
For comparative assertions intended for public disclosure, ISO 14044 includes specific critical review requirements. Independent review can also be useful for consequential procurement or design decisions even when a public comparison is not planned. In either case, retain the calculation model, data sources, allocation rules, cut-off decisions, and sensitivity results so that a reviewer can reproduce the reasoning.
The most useful next step is often a data-quality review rather than another headline footprint. Identify which assumptions drive the result, ask suppliers for evidence on those inputs, and compare alternatives under the same service conditions. ACMD’s focus on two-wheeled mobility, drivetrains, and lightweight materials provides a useful lens for that work: a credible emissions decision connects component engineering to how vehicles are actually produced, maintained, and ridden.